A few words.
A whole new look.
"Make it warmer." "Give the title more room."
Tell AI what to change, and keep creating.
Big difference.
Interactive illustration. In-app AI edits use credits.
Turn text, PDFs, images, and CSV data into a designed infographic on your iPhone or iPad. Pick a layout, ask for edits, then export a PNG.
For iPhone & iPad · iOS 18.6+ · Free with in-app purchases
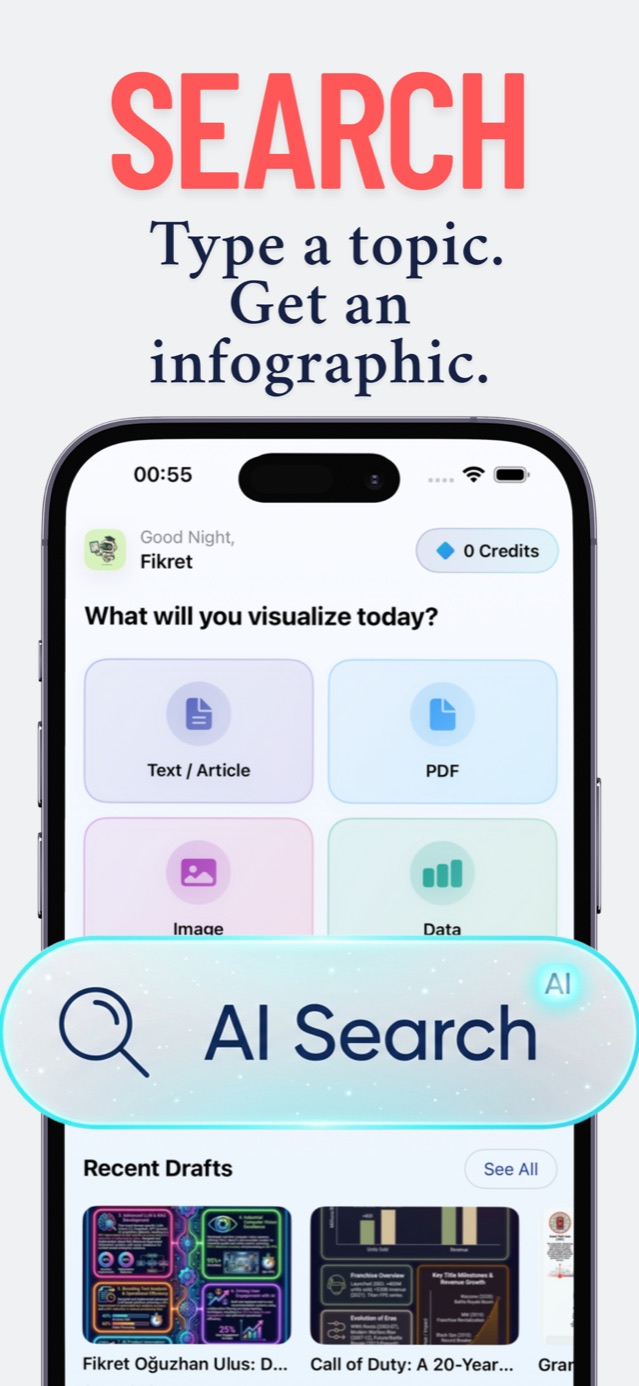
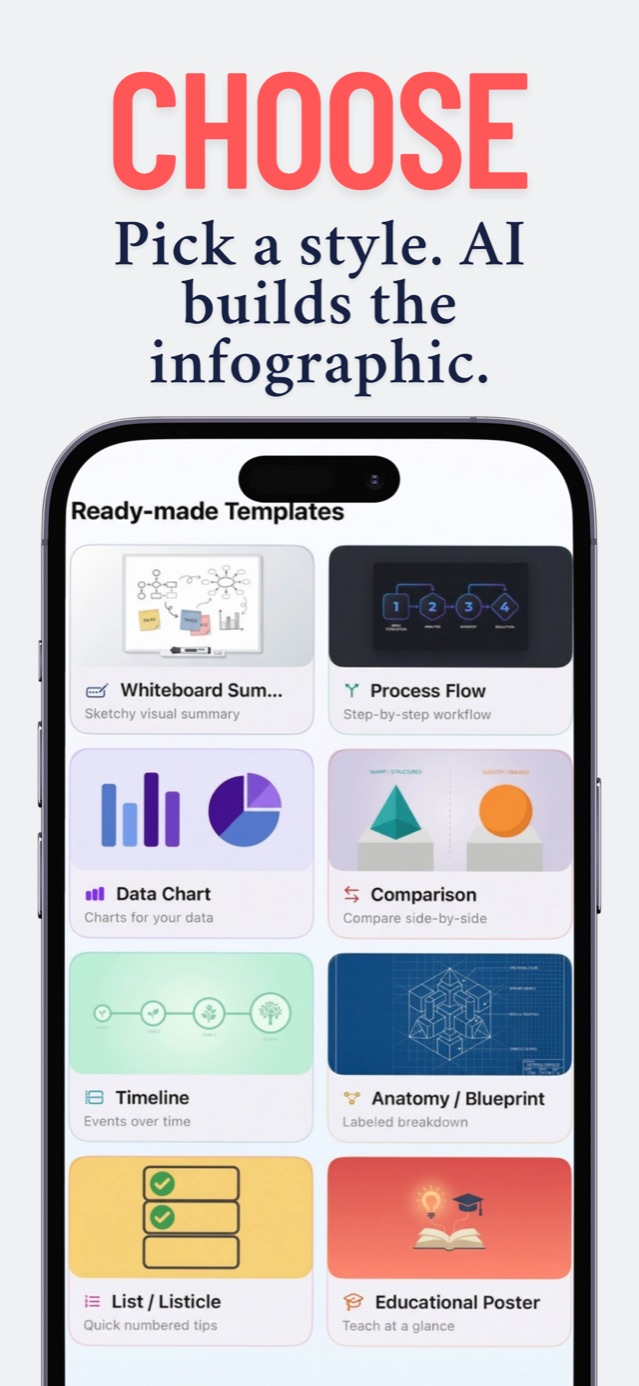
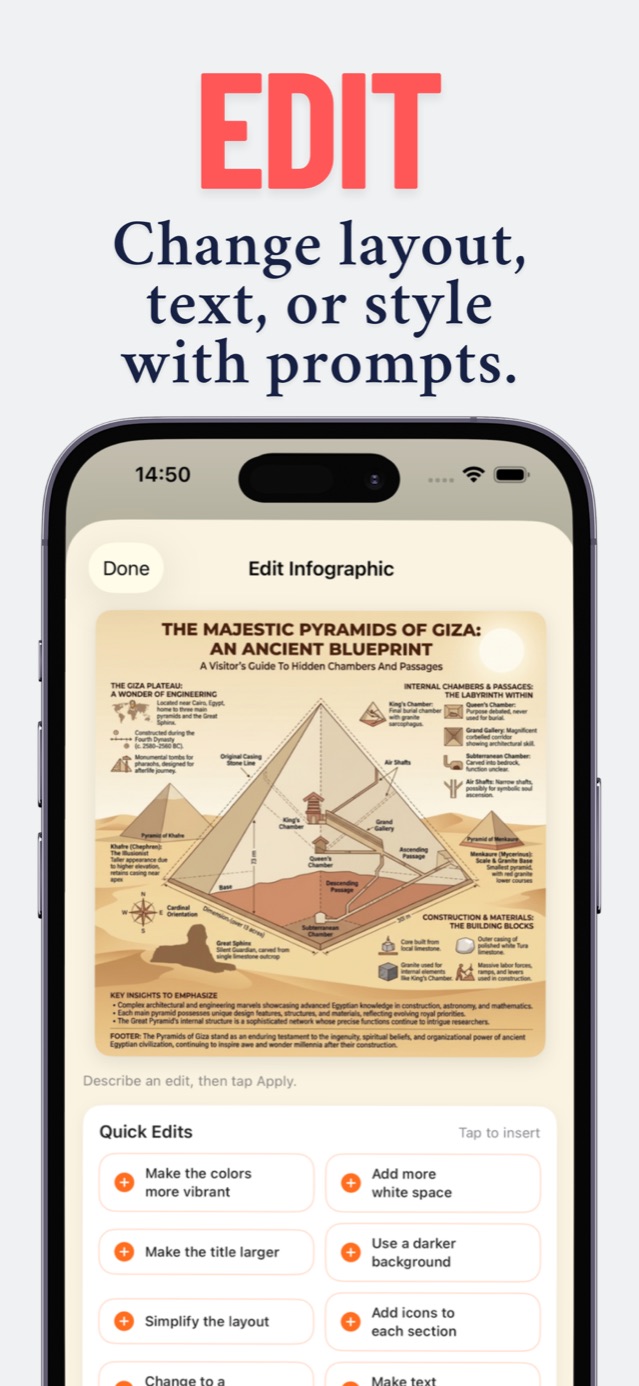
Choose an input, pick a layout, edit with a prompt, and save the finished PNG. These screens come from the current iPhone app.


A few notes. A long report. A topic on your mind.
There's more than one way to make a great visual.
Click or tap an option to see its example.
Paste your notes, an article, or a rough idea. AI finds the key points and gives them a visual structure.
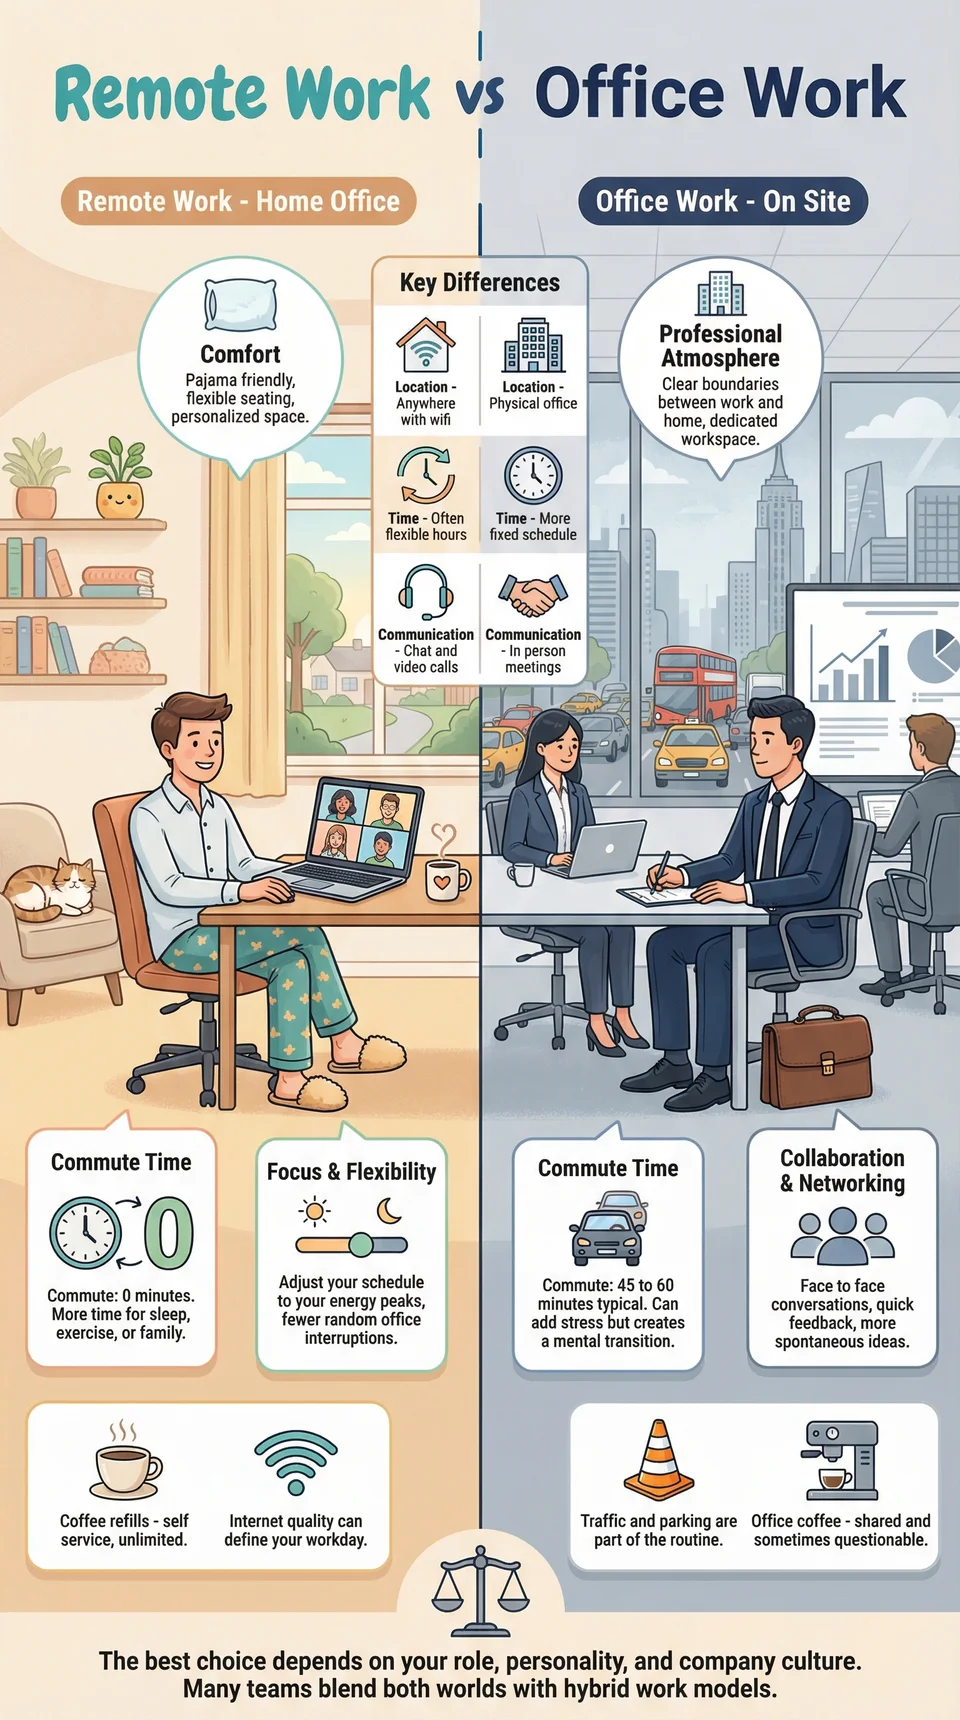
Compare working from home with office life. Show the differences in commuting, flexibility, focus, and collaboration. Keep it friendly and easy to scan.

Illustrative inputs paired with example designs. Create your own in the iOS app. AI results vary.
Paste, import, or start with a topic.
Choose a layout, colors, and format.
Save your infographic and put it out there.
From a study guide to your next big presentation.
Find a look you love, then make it yours.
A selection of example designs. 80 templates across 8 styles in the app.
The first result is a starting point. Make it feel like you.
"Make it warmer." "Give the title more room."
Tell AI what to change, and keep creating.
Interactive illustration. In-app AI edits use credits.
Set your colors, pick a visual tone, and save your own style kits.
Seven aspect ratios. Up to 4K.
One PNG, ready for your next post or presentation.
Good ideas travel. Create in 12 languages.*Non-English infographic output is in beta.
Turn a good idea into a visual for your next social post.
Bring class notes, research, and complex topics into focus.
Make reports, processes, and comparisons easier to follow.
Specific answers for PDFs, spreadsheets, mobile creation, social posts, and layout choices.
Pull the useful ideas from a report, paper, or document and shape them into one visual summary.
Read the guide 02Data to infographicPrepare a spreadsheet, choose the right chart structure, and turn rows of data into a readable graphic.
Read the guide 03AI infographic guidePlan the message, choose a source, review the result, and export a graphic that is ready to share.
Read the guide 04iPhone guideCompare mobile creation workflows and see what to look for in an iPhone infographic maker.
Read the guide 05Social mediaChoose a practical size and layout for Instagram, LinkedIn, Pinterest, and other feeds.
Read the guide 06Layout guideMatch timelines, comparisons, processes, charts, and other structures to the story in your content.
Read the guideClear answers about inputs, editing, layouts, devices, and exports.
Ask us anythingAn AI infographic generator turns source material into a designed visual. Vix AI accepts text, PDFs, images, CSV data, or a topic, then builds a shareable infographic on iPhone or iPad.
Learn moreChoose PDF in Vix AI, import the document, and select a layout and output format. Review the generated visual before saving it as a PNG or sharing it to another app.
Learn moreYes. Choose Data, add your CSV, and pick a chart-focused layout. Vix AI converts the selected data into a visual that you can review and export.
Learn moreYes. Vix AI runs on iPhone and iPad with iOS or iPadOS 18.6 or later. The full workflow, including input, layout choice, prompt-based edits, and PNG sharing, happens in the app.
Learn moreYes. Describe the change you want, such as a larger title, more white space, or a different color treatment. Vix AI applies the prompt to the generated design.
Learn moreThe app includes layouts for timelines, comparisons, process flows, charts, anatomy diagrams, whiteboard summaries, listicles, and educational posters. Pick the structure that matches the information you need to explain.
Learn moreYes. Choose an aspect ratio for the destination, generate the visual, and save or share the PNG. Vix AI supports several output shapes and resolutions up to 4K.
Learn moreYes. New accounts receive 15 welcome credits, enough to create a first infographic. Continued creation requires an in-app purchase, so check the app for current plan and credit prices.
Learn moreYour first infographic is on us.
Download Vix AI and see what you can make.
On your computer?